Familiarising Yourself
The easiest way to find out what Chronolator Review can do is to open the sample file and start using it.
This section suggests a few of the things you might try, and along the way introduces some of the terms used in the tool.
Get Started
|
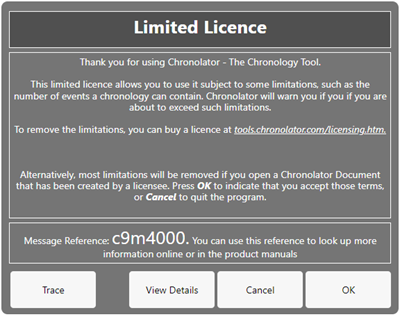
When you first open the tool a licence will be displayed; usually a Limited Licence like this.
|
|
Open Sample 01
|
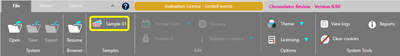
After you accept the licence terms, the Ribbon is displayed. Click on File > Samples > Sample 01. |
|
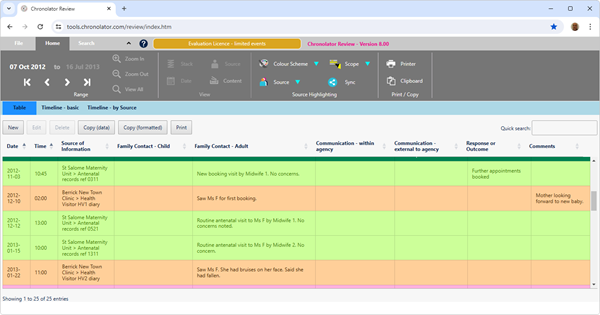
The Home tab of the Ribbon is selected; this tab is where you will do most of your work analysing the chronology.
The chronology is displayed in the Presentation Area. Three tabs at the top of the area 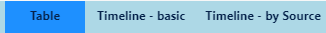 let you choose different views.
Sample 01 is a short fictitious chronology such as might have been produced by a Health organisation investigating the death of a child. It has been partially anonymised using abbreviations such as SJW, Ms F, and GP1.
Using the Table presentation
See Table Presentation for a detailed description of the buttons and controls on this presentation.
Sort
By default, the events in the table are in Date / Time order. You can sort the table by different columns if you want.

For example, clicking on Source of Information in the table header row will sort the table by agency, in ascending order. Clicking it again will sort in descending order.
To go back to date order, just click Date in the table header row.
To sort by multiple columns, hold the Shift key as you click on a heading.
To return to Chronolator's default sort, press File > Resume.
 Sorting the Table has no effect on the Timeline presentations.
Quick Search

You can use the box in the top right corner of the Presentation Area to search for text. Only those events that contain your search terms are displayed.
Searches are cumulative - the more terms you enter, the fewer events are displayed. This can provide a powerful way to sift through desired events.
Try searching for Ms F - only the events in which she plays a part are shown.
Next, add midwife to the search - Ms F's interactions with midwives are shown.
 Quick Search only searches the Table presentation. Use Search > Criteria to search across all presentations (see Searching and filtering events for details).
Editing events
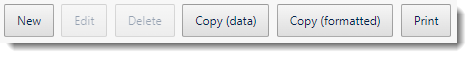
The buttons between the table and the Ribbon let you add, change, or delete events. You must click an event to select it before using the Edit or Delete buttons.
You can also invoke the Editor commands by right-clicking on an event to display this
Context Menu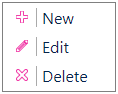 .
.
Using the Timeline presentations
|
|
|
|
Timeline - basic |
Timeline - by Source |
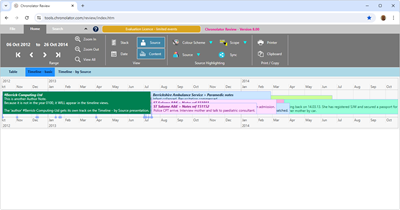
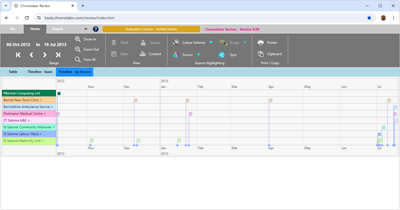
There are two Timeline views: Timeline - basic and Timeline - by Source.
The first one shows all events on the same line, while the second has a different line for each agency.
Another difference between them as they are first presented is that the first one shows the details of each event, while the second shows a coloured empty box. The entire event is displayed if you hover the mouse over the box.
Experiment with the buttons in the Home > View group to control the level of detail shown in an event. See Timeline Presentations for more details.
Common controls
Some controls affect every tab in the Presentation Area - the table and the timelines.
File tab common controls
All the controls on the File tab affect every presentation. See the description of the File Tab for details.
Home tab common controls
The Range group
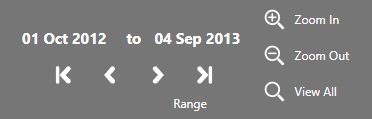
Controls in this group affect the range of events that is displayed.
Click on the Start or End date to change it. Either type the date you want, or use the calendar that opens.
Use the DVD-like buttons under the dates display to go to the first, previous, next, and last events.
The Zoom buttons are not active in the Table tab. In a Timeline tab, use them to expand or contract the range of events.
See Using the Range Controls for more details.
The Source Highlighting group
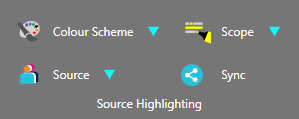
Use the buttons in this group to change the colours used to highlight agencies.
The Colour Scheme button affects all the agencies at the same time. Use it to choose an overall theme. When you press it, a list of schemes is shown. As you hover over each item in the list, you can see its effect on the presentation. Click on an item to set it.
The Source button affects a single agency. When you press it, a list of agencies is shown.
Click on the desired agency to display a swatch of possible colours. As you hover over each colour in the swatch, you can see its effect (as long as the selected agency has an event on screen). Click on a colour to set it.
The Scope button lets you decide how much of an event is highlighted.
By default, the colours used apply only to the presentation on which you set them. Use the Sync button to copy them to the other presentations.
The Print / Copy group
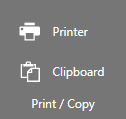
The Printer and Clipboard buttons in this group print or copy what is displayed in the active presentation.
It must be said that the Chronolator Browser Tools are mainly designed for interactive use, and printing and copying are not their strongest features. You might prefer to use other specialised screen-grab tools to achieve what you want.
The Printer button invokes the browser's printer. You might need to set its options to get the desired results - for example, to get colours in Chrome, you need to set it to include background graphics.
Searching the chronology
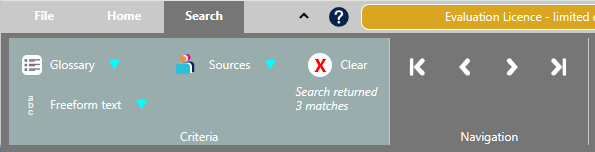
Use the buttons in the Search > Criteria group to build and execute complex searches that apply to all presentations, and use the buttons in the Navigation group to go to the first, previous, next, or last matching event.
Press Freeform text and choose one of the searches that are listed to display the Search Builder. Experiment with the Show Only and other buttons. Notice that when you execute a search the Criteria group is given a different background and includes information about how many matching events were found.
See Searching and filtering events for more details.